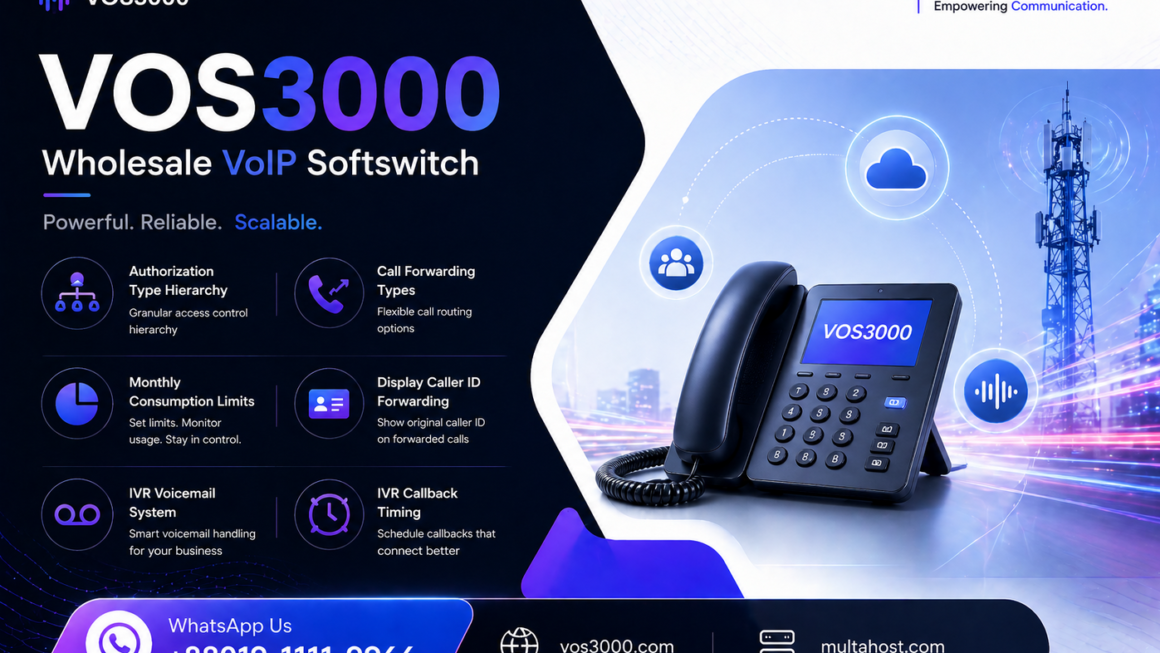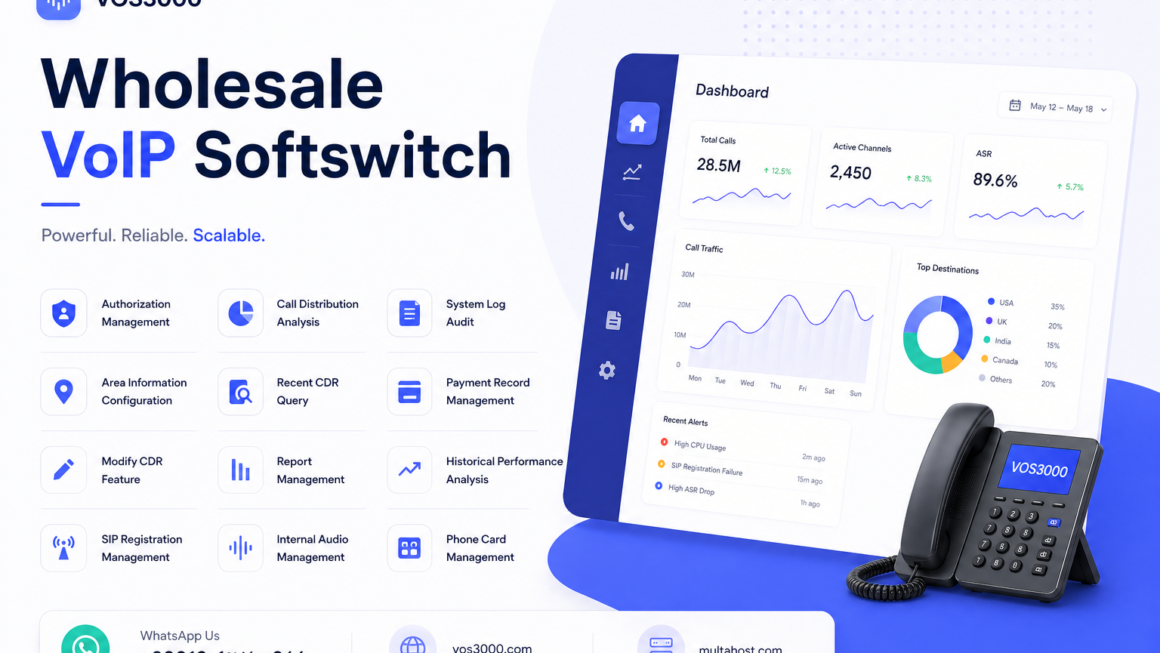


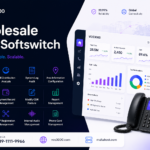


VOS3000 Call Distribution Analysis: Complete Traffic Pattern Analytics Guide
📊 How do VoIP operators understand when their network is busiest, which destinations drive the most traffic, and how calls are distributed across gateways and time periods? The VOS3000 call distribution analysis module provides comprehensive traffic pattern analytics that reveal the hidden patterns in call flows — enabling operators to optimize capacity, improve routing, and make data-driven business decisions. 🔧
⚙️ According to the official VOS3000 V2.1.9.07 Manual, Section 2.9.1 (Call Distribution), this module analyzes call volume distribution across multiple dimensions including time (hourly, daily), destination (area, prefix), gateway, and account. VOS3000 call distribution analysis transforms raw CDR data into actionable insights that drive capacity planning and traffic engineering. 📈
🎯 This guide covers the complete VOS3000 call distribution analysis system: analysis dimensions, query configurations, result interpretation, visualization, and practical use cases. For expert VOS3000 configuration assistance, contact us on WhatsApp at +8801911119966. 📱
Table of Contents
🔐 Overview of VOS3000 Call Distribution Analysis
📞 The VOS3000 call distribution analysis module aggregates call detail records into statistical distributions that reveal traffic patterns. Instead of looking at individual calls, operators see the big picture: how call volume varies by hour of day, which prefixes are most popular, and how traffic is distributed across their gateway infrastructure. 💡
🌐 Key dimensions of VOS3000 call distribution analysis:
- ⏰ Time Distribution: Call volume by hour, day, or custom time period
- 🌍 Destination Distribution: Traffic breakdown by country, area, or prefix
- 📡 Gateway Distribution: Traffic volume per routing/mapping gateway
- 👤 Account Distribution: Traffic contribution by customer or reseller
- 💰 Revenue Distribution: Revenue concentration by dimension
| Distribution Type | X-Axis | Y-Axis Metrics |
|---|---|---|
| ⏰ Hourly | Hour of day (0-23) | Call count, duration, revenue |
| 📅 Daily | Date | Call count, duration, revenue |
| 🌍 By Destination | Country/Area/Prefix | Call count, minutes, cost |
| 📡 By Gateway | Gateway name | Call count, ASR, ACD |
| 👤 By Account | Account name | Call count, revenue, profit |
⚙️ Step-by-Step VOS3000 Call Distribution Analysis
🔧 Running a call distribution analysis in VOS3000 follows these steps:
Step 1: Navigate to Call Distribution 📡
- 🔐 Log in to VOS3000 Client with administrator credentials
- 📌 Navigate to: CDR Analysis → Call Distribution
- 🔍 The Call Distribution analysis form appears
Step 2: Configure Analysis Parameters 📋
| Parameter | Description | Options |
|---|---|---|
| 📅 Date Range | Period to analyze | Today, Yesterday, Last 7 days, Custom |
| 📊 Distribution By | Primary dimension | Hour, Day, Gateway, Account, Area |
| 👤 Account Filter | Limit to specific accounts | All or selected accounts |
| 📡 Gateway Filter | Limit to specific gateways | All or selected gateways |
| 📞 Number Filter | Filter by prefix/destination | Specific prefix or wildcard |
Step 3: Interpret Results 📊
📋 The VOS3000 call distribution analysis presents results in both tabular and chart formats:
| Metric | Description | Business Insight |
|---|---|---|
| 📞 Total Calls | Number of call attempts | Overall traffic volume |
| ✅ Connected Calls | Successfully answered calls | Effective traffic (ASR indicator) |
| ⏱️ Total Duration | Billable minutes | Revenue potential |
| ⏱️ Avg Duration | Average call length | Customer engagement quality |
| 💰 Revenue | Total billed amount | Income generated |
| 💰 Cost | Termination costs | Profitability indicator |
📈 Practical Applications of Call Distribution Analysis
| Use Case | Analysis Configuration | Action from Insights |
|---|---|---|
| 📊 Capacity Planning | Hourly distribution over 7 days | Scale gateway capacity for peak hours |
| 🌍 Market Analysis | Distribution by destination country | Negotiate better rates for top destinations |
| 📡 Gateway Optimization | Distribution by gateway + ASR | Reroute traffic from low-ASR gateways |
| 👤 Customer Insights | Distribution by account | Identify top customers for VIP treatment |
💬 For traffic analysis support, WhatsApp us at +8801911119966. 📱
📊 Understanding the Four Distribution Views
📈 The VOS3000 call distribution analysis module provides four distinct distribution views, each offering a different perspective on traffic patterns. According to the VOS3000 V2.1.9.07 Manual, Section 2.9.1, these four views — Call Distribution, Duration Distribution, Revenue Distribution, and Expenditure Distribution — together provide a comprehensive picture of how traffic flows through the system. The Call Distribution view shows the volume of call attempts across the selected dimension, helping identify peak usage periods and popular destinations.
The Duration Distribution view reveals how talk time is distributed, which differs significantly from call count distribution — a few long calls can generate more minutes than many short calls. The Revenue Distribution view maps where income is concentrated, which is critical for identifying your most profitable traffic segments. The Expenditure Distribution view tracks where costs are concentrated, essential for identifying expensive routes that may need renegotiation or rerouting. 📊
| Distribution View | What It Reveals | Business Decision |
|---|---|---|
| 📞 Call Distribution | Where call volume concentrates | Capacity planning, resource allocation |
| ⏱️ Duration Distribution | Where talk time concentrates | Revenue forecasting, rate optimization |
| 💰 Revenue Distribution | Where income is generated | Sales focus, marketing strategy |
| 💸 Expenditure Distribution | Where costs accumulate | Cost reduction, carrier negotiation |
🔄 Using Distribution Analysis for Route Optimization
📡 One of the most valuable applications of VOS3000 call distribution analysis is route optimization. By analyzing call distribution by gateway alongside revenue and expenditure distributions, operators can identify routes that carry high traffic volume but generate low profit margins — these are candidates for rate renegotiation or alternative routing.
Conversely, routes with low traffic but high profit margins represent growth opportunities where increasing traffic allocation could significantly boost revenue. The combined view of all four distribution dimensions enables operators to make data-driven routing decisions rather than relying on intuition or carrier-provided quality metrics alone. This analytical approach to route management typically yields 5-15% improvement in overall profit margins for wholesale VoIP operations. 📈
⚠️ Common Analysis Pitfalls
🔧 While VOS3000 call distribution analysis is a powerful tool, operators should be aware of common analytical pitfalls. First, analyzing too short a time period can lead to conclusions based on anomalies rather than patterns — always use at least 7 days of data for meaningful distribution analysis. Second, failing to filter out test calls and internal traffic can skew distribution results, making regular business traffic patterns harder to identify.
Third, focusing only on call count without considering duration and revenue can lead to misallocated resources — a destination with many short failed calls looks important by volume but contributes no revenue. Finally, seasonal variations (holiday periods, weekends vs. weekdays) must be accounted for when using distribution data for capacity planning. 📋
❓ Frequently Asked Questions
❓ How far back can I analyze call distribution data?
📅 VOS3000 call distribution analysis can query any historical period for which CDR data exists in the system. The practical limit depends on your CDR retention policy and database size. Most operators retain 6-12 months of detailed CDR data for analysis. For longer-term trend analysis, use the report management scheduled reports to save monthly summaries. 📊
❓ Can I compare call distribution between two time periods?
📈 The VOS3000 call distribution analysis interface analyzes one period at a time. To compare periods (e.g., this week vs last week), run two separate analyses and compare the exported results in Excel. This approach provides full flexibility in comparison methodology. Some operators create custom dashboards that automatically pull VOS3000 data via the Web API for period-over-period comparisons. 📊
❓ What is the difference between Call Distribution and Historical Performance?
📊 Call Distribution shows how traffic is distributed across dimensions (time, destination, gateway) — it’s about the pattern and spread of traffic. Historical Performance focuses on quality metrics (ASR, ACD, PDD) over time — it’s about how well the network is performing. Together, they provide both the “what” (distribution) and “how well” (performance) of your traffic. 📈
❓ Can call distribution data be exported for external BI tools?
📥 Yes, VOS3000 call distribution analysis results can be exported to Excel format for import into business intelligence tools like Tableau, Power BI, or Grafana. The exported data includes all distribution dimensions and metrics in a structured format ready for visualization. For real-time BI integration, use the VOS3000 Web API to pull data programmatically. 📊
❓ How accurate is the call distribution analysis?
🎯 VOS3000 call distribution analysis is 100% accurate relative to the CDR data in the system. It performs aggregation directly on the CDR database, so the results reflect exactly what was recorded. Any discrepancies between expected and actual distribution should be investigated through the CDR query interface to verify individual call records. 📋
❓ Can I schedule automatic call distribution reports?
🔄 While the call distribution analysis interface is designed for on-demand interactive analysis, operators can create similar reports through the report management system. Scheduled reports like “Mapping Gateway Analysis Report” and “Routing Gateway Analysis Report” provide distribution-style data on automated schedules. 📊
📊 Interpreting Call Distribution Charts and Graphs
📈 The VOS3000 call distribution analysis module presents results in both tabular and graphical formats. Understanding how to read these visualizations is essential for extracting actionable insights. The hourly call distribution chart typically shows a bell-curve pattern for business traffic, with peak volumes during business hours (9 AM to 6 PM) and lower volumes during nighttime hours. Significant deviations from this expected pattern — such as unexpected spikes at 3 AM or sustained high volumes on weekends — may indicate either a new customer segment (such as residential VoIP users) or potential fraud (automated call generation).
The destination distribution chart shows which countries or prefixes account for the most traffic, and operators should compare this against their rate card to identify high-traffic destinations where better carrier rates could significantly reduce costs. The revenue distribution chart reveals the Pareto principle in action — typically 20% of destinations generate 80% of revenue, making these high-value routes the priority for quality monitoring and carrier management. 📊
🎯 Key patterns to identify in call distribution analysis:
- 📈 Peak Hour Identification: Determine your busiest hours for capacity planning and staffing
- 🌍 Top Destinations: Identify the 10-20 prefixes that account for 80%+ of your traffic
- 💰 Revenue Concentration: Find which destinations generate the most revenue per minute
- 💸 Cost Hotspots: Locate destinations with high expenditure but low profit margins
- 🔄 Growth Trends: Track week-over-week changes in traffic volume by destination
- ⚠️ Anomalous Spikes: Detect unusual traffic patterns that may indicate fraud or misrouting
📅 Seasonal and Holiday Traffic Analysis
🎄 VoIP traffic patterns are strongly influenced by seasonal factors, national holidays, and cultural events. Understanding these patterns through VOS3000 call distribution analysis enables operators to prepare for expected traffic surges and avoid being caught off-guard.
Major holidays such as Eid, Christmas, Diwali, and Chinese New Year generate massive spikes in international calling traffic as people call family and friends abroad. These traffic surges can be 3-10 times normal daily volume, requiring advance capacity planning and carrier coordination. By running call distribution analysis for previous holiday periods, operators can predict the expected surge magnitude and timing for upcoming holidays, negotiate temporary capacity increases with carriers, and ensure sufficient system resources are available. The Work Calendar feature in VOS3000 (Section 2.12.4) can be configured to define special billing periods around holidays, enabling rate adjustments during these high-demand periods. 📊
🔧 Call Distribution Analysis Configuration Tips
⚙️ Getting the most accurate and useful results from VOS3000 call distribution analysis requires proper configuration of the analysis parameters. Always select a date range that is long enough to reveal meaningful patterns but short enough to avoid averaging out important variations — seven days is typically the sweet spot for daily operational analysis.
When analyzing by hour, include both weekdays and weekends separately, as traffic patterns differ significantly between business days and rest days. For destination analysis, use the most specific prefix level available rather than just country codes, as mobile and fixed-line traffic to the same country often follow very different patterns. The account filter is particularly valuable for wholesale operators who want to analyze traffic patterns for individual resellers separately, revealing each reseller’s unique calling pattern. Exporting results to Excel for custom charting and comparison is recommended for presentations to management or for detailed capacity planning exercises. 📊
📞 Need Expert Help with VOS3000 Call Distribution Analysis?
🔧 Effective VOS3000 call distribution analysis reveals the patterns that drive better routing, capacity planning, and business decisions. Whether you need help configuring analysis parameters, interpreting results, or building traffic dashboards, our team is ready to assist. 💬 WhatsApp: +8801911119966 — Get instant expert support for VOS3000 traffic analytics.
📚 Related Resources
- 📊 VOS3000 Historical Performance Analysis
- 📋 VOS3000 Report Management
- 📈 VOS3000 Gateway Analysis
- 📡 VOS3000 CDR Query
- 🔧 VOS3000 System Log Audit
- ⚙️ VOS3000 Parameter Description
- 📞 VOS3000 Softswitch VoIP
📞 Still have questions about VOS3000 call distribution analysis? Reach out on WhatsApp at +8801911119966 — we provide professional VOS3000 installation, configuration, and traffic analysis services worldwide. 🌐
📞 Need Professional VOS3000 Setup Support?
For professional VOS3000 installations and deployment, VOS3000 Server Rental Solution:
📱 WhatsApp: +8801911119966
🌐 Website: www.vos3000.com
🌐 Blog: multahost.com/blog
📥 Downloads: VOS3000 Downloads
 | | |