


VOS3000 Historical Performance Analysis: Complete ASR ACD Quality Metrics Guide
📈 How do VoIP operators track whether their network quality is improving or declining over time? Which carriers are consistently delivering the best answer seizure ratios? The VOS3000 historical performance analysis module provides longitudinal quality metrics tracking — enabling operators to analyze ASR (Answer Seizure Ratio), ACD (Average Call Duration), and PDD (Post Dial Delay) trends across any historical period, gateway, or destination. 🔧
⚙️ According to the official VOS3000 V2.1.9.07 Manual, Section 2.9.2 (Historical Performance), this module aggregates call quality statistics over time to reveal performance trends. Unlike the real-time gateway status view, VOS3000 historical performance analysis shows patterns across days, weeks, or months — providing the context needed for carrier scorecarding and quality management. 📊
🎯 This guide covers the complete VOS3000 historical performance analysis system: quality metrics definitions, analysis configuration, trend interpretation, carrier scorecarding, and optimization strategies. For expert VOS3000 configuration assistance, contact us on WhatsApp at +8801911119966. 📱
Table of Contents
🔐 Overview of VOS3000 Historical Performance Analysis
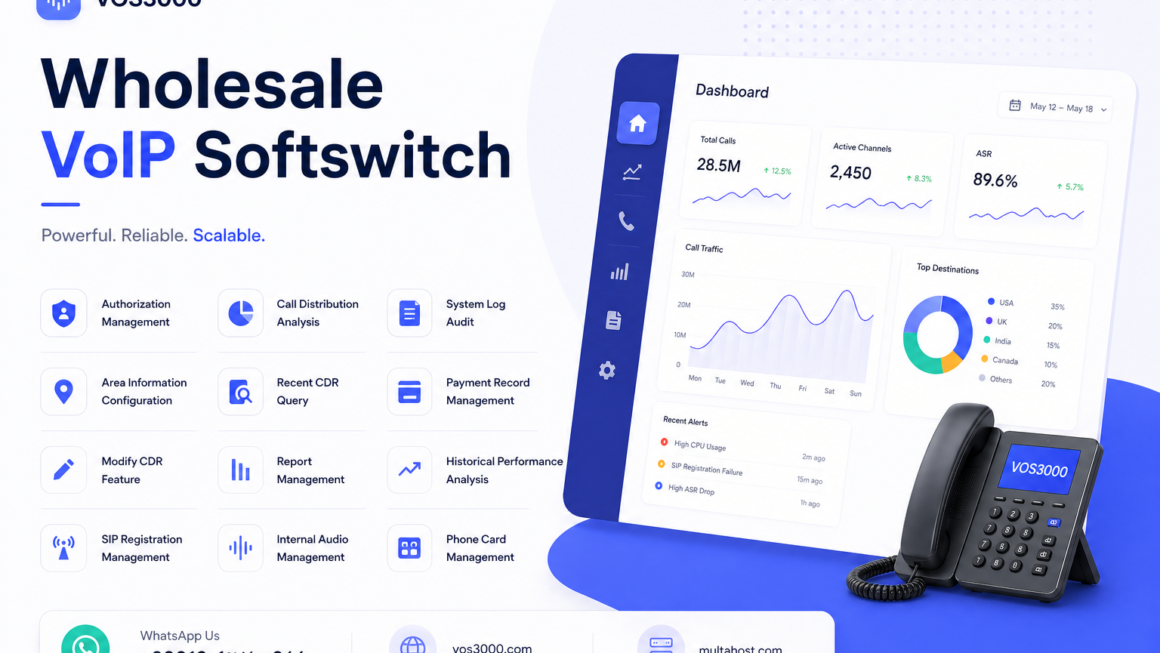
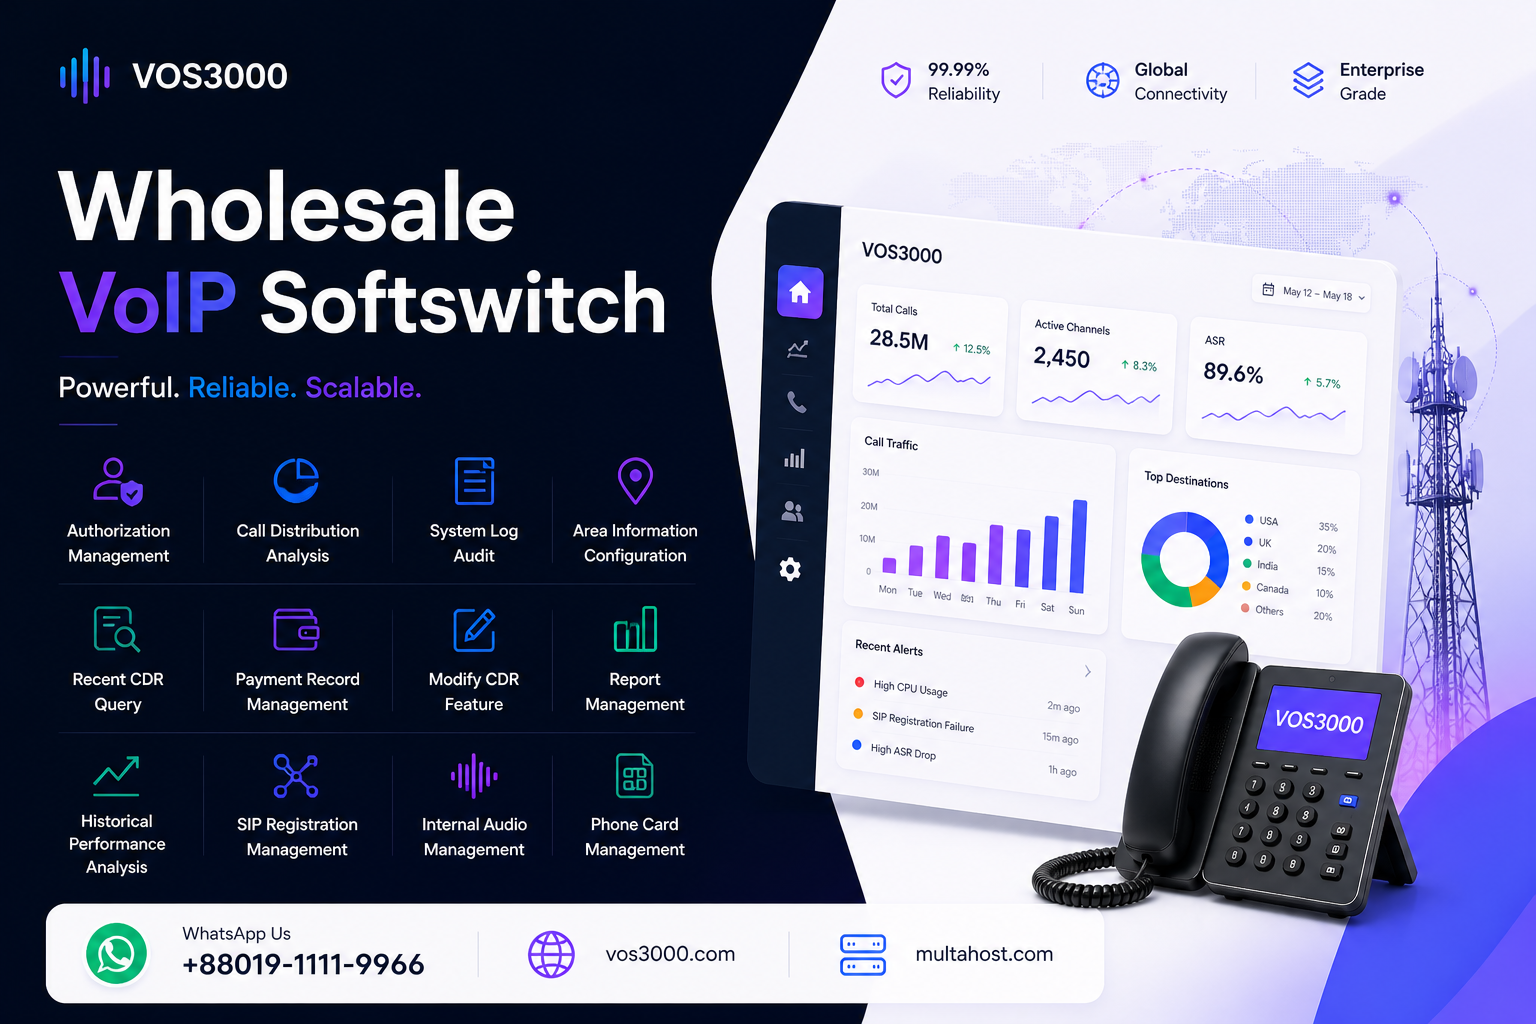
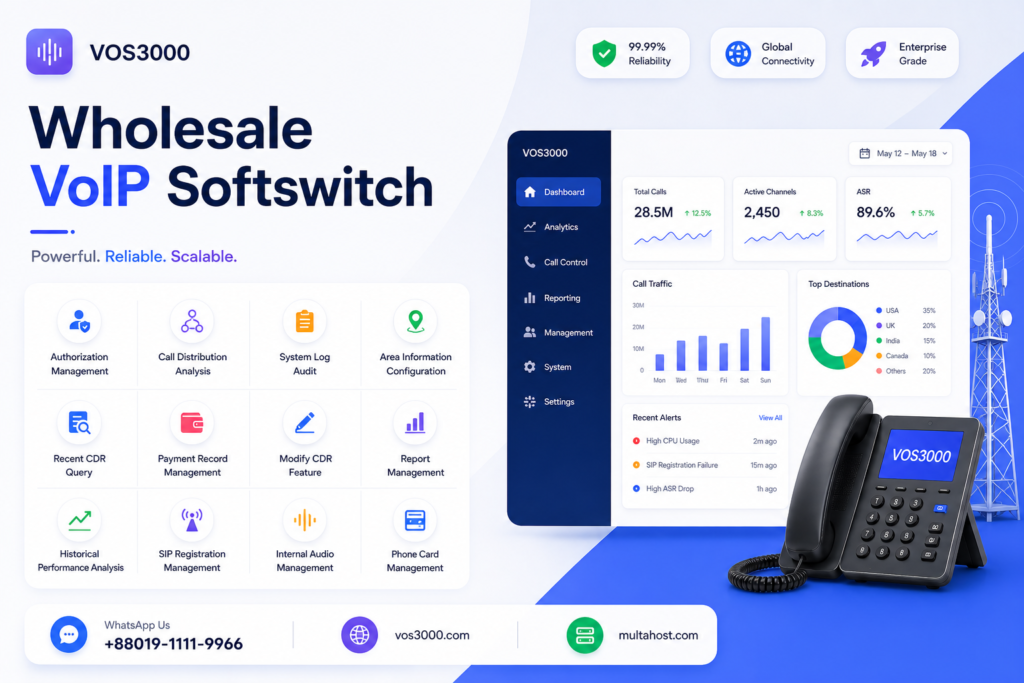
📞 The VOS3000 historical performance analysis module transforms raw CDR data into quality trend analysis. It calculates key performance indicators (KPIs) over configurable time periods — enabling operators to identify degrading routes, celebrate improving carriers, and make evidence-based routing decisions. 💡
🌐 Key quality metrics tracked by VOS3000 historical performance analysis:
- 📞 ASR (Answer Seizure Ratio): Percentage of calls that are successfully answered
- ⏱️ ACD (Average Call Duration): Mean duration of connected calls
- ⏱️ PDD (Post Dial Delay): Time from call initiation to first ringing/answer
- 📊 Call Volume: Total call attempts and connected calls
- 💰 Revenue per Call: Average revenue generation efficiency
| Metric | Formula | Good Range | Poor Range |
|---|---|---|---|
| 📞 ASR | Answered Calls / Total Calls × 100% | 40% – 70% | < 30% |
| ⏱️ ACD | Total Duration / Answered Calls | 3 – 8 minutes | < 1 minute |
| ⏱️ PDD | Setup time to ring/answer | 2 – 6 seconds | > 10 seconds |
⚙️ Step-by-Step VOS3000 Historical Performance Analysis
🔧 Running historical performance analysis in VOS3000 follows these steps:
Step 1: Navigate to Historical Performance 📡
- 🔐 Log in to VOS3000 Client with administrator credentials
- 📌 Navigate to: CDR Analysis → Historical Performance
- 🔍 The Historical Performance analysis form appears
Step 2: Configure Analysis Parameters 📋
| Parameter | Description | Example |
|---|---|---|
| 📅 Start Date | Analysis period beginning | 2026-01-01 |
| 📅 End Date | Analysis period ending | 2026-04-30 |
| 📊 Group By | Time aggregation interval | Day / Week / Month |
| 📡 Gateway | Filter by specific gateway(s) | All or GW_USA_Premium |
| 👤 Account | Filter by account | All or specific reseller |
| 📞 Destination | Filter by prefix/country | 92 (Pakistan), 91 (India) |
Step 3: Interpret Performance Trends 📊
| Trend Pattern | What It Means | Recommended Action |
|---|---|---|
| 📈 ASR Rising | Route quality improving | Increase traffic allocation to this route |
| 📉 ASR Falling | Route quality degrading | Investigate carrier, reduce allocation |
| 📈 ACD Rising | Calls lasting longer | Good sign — revenue per call increasing |
| 📉 ACD Falling | Calls ending sooner | Check for quality issues, premature disconnects |
| 📈 PDD Rising | Setup delays increasing | Carrier network congestion or routing issues |
📊 Carrier Scorecarding with VOS3000 Historical Performance
🏆 One of the most powerful applications of VOS3000 historical performance analysis is carrier/vendor scorecarding. By comparing performance metrics across multiple gateways over the same period, operators can objectively rank their carriers:
| Carrier | ASR | ACD | PDD | Score |
|---|---|---|---|---|
| 📡 Carrier A | 62% | 4.2 min | 3.1 sec | ⭐⭐⭐⭐⭐ |
| 📡 Carrier B | 48% | 3.8 min | 5.4 sec | ⭐⭐⭐⭐ |
| 📡 Carrier C | 31% | 2.1 min | 8.9 sec | ⭐⭐ |
🔄 Using VOS3000 Historical Performance for Route Optimization
📡 The primary business application of VOS3000 historical performance analysis is route optimization through evidence-based carrier management. By tracking ASR, ACD, and PDD trends for each termination gateway over time, operators can make informed decisions about traffic allocation. When a carrier’s ASR shows a consistent downward trend over two or more weeks, this signals a quality degradation that warrants investigation and potentially reducing traffic allocation to that route.
Conversely, carriers with improving or stable high ASR should receive increased traffic allocation to maximize call completion rates and revenue. The historical performance data transforms carrier management from a reactive process (waiting for customer complaints) to a proactive one (detecting quality changes before they impact customers). 📈
📊 Route optimization decision framework using historical performance:
| Performance Pattern | Duration | Recommended Action |
|---|---|---|
| 📉 ASR drop > 10% | 1-2 days | Monitor, investigate root cause |
| 📉 ASR drop > 15% | 3-7 days | Reduce traffic, contact carrier, add backup route |
| 📈 PDD increase > 30% | 1 week+ | Investigate network path, consider alternative route |
| 📉 ACD drop > 20% | 2+ weeks | Quality issue — check for audio problems, route congestion |
| 📈 ASR consistently high | 1 month+ | Increase traffic allocation, negotiate better rates |
📊 Performance Analysis and SLA Compliance
⚖️ For VoIP operators who provide Service Level Agreements (SLAs) to their customers, VOS3000 historical performance analysis is the tool for proving SLA compliance. SLAs typically specify minimum ASR thresholds, maximum PDD limits, and minimum ACD values for different destination categories. By running historical performance analysis for each SLA-covered destination over the contract period, operators can generate objective evidence of whether they met or exceeded the agreed quality standards.
This data is invaluable during SLA review meetings and can prevent unwarranted penalty charges from customers who claim quality was below standards. Operators should establish a regular cadence of SLA reporting — typically monthly — using the historical performance analysis module as the data source, supplemented by data from the report management system for financial SLA metrics. 📋
⚠️ Interpreting Performance Data Correctly
🔍 Correct interpretation of VOS3000 historical performance data requires understanding the context behind the numbers. A low ASR does not always indicate a carrier problem — it may reflect legitimate network conditions in the destination country (such as mobile phone switched off, busy lines, or network congestion during peak hours). Similarly, short ACD values may indicate that callers in certain cultural contexts naturally make shorter calls, not that call quality is poor.
PDD values can be affected by the originating network’s dial plan configuration, not just the terminating carrier’s performance. The key to meaningful analysis is comparing performance against your own historical baseline for the same destination, same time period, and same traffic pattern, rather than using generic industry benchmarks. Week-over-week and month-over-month comparisons of the same route provide the most actionable insights. 📊
💡 Best Practices for Historical Performance Analysis
| Practice | Recommendation |
|---|---|
| 📅 Weekly Reviews | Run performance analysis every Monday for previous week |
| 🌍 By Destination | Analyze top 10 destinations separately — quality varies by route |
| 📊 Set Thresholds | Define minimum ASR/ACD thresholds per destination |
| 📈 Track Trends | Focus on week-over-week changes, not absolute values |
| 📧 Share Reports | Send carrier scorecards to vendors monthly |
💬 For performance analysis support, WhatsApp us at +8801911119966. 📱
❓ Frequently Asked Questions
❓ How does VOS3000 calculate ASR in historical performance?
📞 VOS3000 calculates ASR as: (Number of calls with status “Answered” / Total number of call attempts) × 100%. Calls with statuses like “Busy,” “No Answer,” “Cancel,” and failed calls are counted in the denominator but not the numerator. This is the industry-standard ASR calculation. The historical performance analysis aggregates this across the selected time period and grouping interval (day/week/month). 📊
❓ What is a good ASR value for international VoIP routes?
🎯 ASR benchmarks vary significantly by destination country and route type. Generally: Premium routes to developed countries (USA, UK, Western Europe) should achieve 50-70% ASR. Routes to developing markets may see 30-50% ASR. CLI routes typically have higher ASR than non-CLI. If ASR drops below 25% consistently, investigate carrier quality or potential fraud. Always compare against your own historical baseline for the same destination rather than generic benchmarks. 📈
❓ Can I set up automated alerts when performance drops?
🚨 Yes, VOS3000 provides mapping and routing alarms that can trigger when ASR, ACD, or call rate fall below configured thresholds. These alarms can send email notifications, SMS, or voice alerts. For historical trend-based alerting (e.g., “alert when ASR drops 10% week-over-week”), use external monitoring tools that pull data via the VOS3000 Web API. 📊
❓ How far back can I analyze historical performance?
📅 The analysis range is limited only by your CDR retention policy. Most operators retain 3-12 months of granular CDR data. For longer-term analysis, the report management scheduled reports can save monthly performance summaries indefinitely. Performance analysis on very large date ranges (6+ months) may take longer to generate. ⏱️
❓ What causes sudden ASR drops?
⚠️ Sudden ASR drops can be caused by: (1) Carrier network issues or outages, (2) Route congestion during peak hours, (3) Destination country regulatory blocks, (4) CLI suppression on routes requiring CLI, (5) Fraud attacks generating fake call attempts, (6) Incorrect routing configuration sending calls to wrong gateway. Use the call distribution analysis combined with gateway fail analysis to identify root causes. 🔧
❓ Can I compare multiple gateways in one analysis?
📊 Yes, the VOS3000 historical performance analysis allows selecting multiple gateways for comparison. The results show performance metrics side-by-side for each gateway, making it easy to identify your best and worst performing carriers. This is the recommended approach for carrier scorecarding and route optimization decisions. 📈
📊 Advanced Historical Performance Analysis Techniques
🔧 Beyond basic ASR/ACD/PDD tracking, experienced VOS3000 operators employ several advanced analysis techniques using historical performance data. One powerful technique is “same-day comparison” — running historical performance analysis for the same day of the week across multiple weeks (e.g., comparing all Mondays in a month) to establish a reliable baseline while controlling for day-of-week traffic variations. Another technique is “gateway pair analysis” — comparing two gateways that carry traffic to the same destination to determine which one consistently delivers better quality, enabling evidence-based routing decisions.
A third technique is “pre/post change analysis” — running historical performance for the period before and after a configuration change (such as a route modification or carrier switch) to objectively measure the impact of the change on call quality metrics. These systematic approaches transform historical performance analysis from a passive reporting tool into an active decision-making framework. 📈
📊 Advanced analysis methodology:
- 📅 Baseline Establishment: Run 30-day historical performance for each major destination to establish normal ASR/ACD/PDD ranges
- 📊 Threshold Definition: Set alert thresholds at 2 standard deviations from baseline for each metric
- 🔍 Anomaly Detection: Compare current week performance against baseline to identify statistically significant deviations
- 📡 Root Cause Analysis: When anomalies are detected, drill down by gateway and time-of-day to isolate the cause
- 🔄 Corrective Action: Adjust routing, contact carriers, or modify configuration based on analysis findings
- 📈 Verification: Re-run analysis after corrective action to confirm the issue is resolved
⚙️ Performance Analysis System Configuration
🔧 The VOS3000 historical performance analysis module relies on underlying CDR data for its calculations. The accuracy and granularity of the analysis depends on several system configuration factors. The CDR write interval parameter determines how quickly call records are written to the database — shorter intervals provide more real-time data but increase database load. The CDR retention policy determines how far back historical performance analysis can reach — operators who need 12-month trend analysis must ensure their CDR retention covers at least that period.
The database performance also affects analysis speed — queries on very large CDR datasets (millions of records) may take several minutes to complete. For optimal analysis performance, operators should maintain database indexes, regularly clean up old CDR data through the Data Maintenance module, and schedule large analyses during off-peak hours. The system parameter for CDR aggregation intervals can also be tuned to balance between analysis granularity and storage efficiency. ⏱️
📞 Need Expert Help with VOS3000 Historical Performance Analysis?
🔧 Effective VOS3000 historical performance analysis is the foundation of quality-driven routing and carrier management. Whether you need help configuring analysis parameters, interpreting trends, or setting up carrier scorecards, our team is ready to assist. 💬 WhatsApp: +8801911119966 — Get instant expert support for VOS3000 quality analytics.
📚 Related Resources
- 📊 VOS3000 Call Distribution Analysis
- 📋 VOS3000 Mapping Alarm Configuration
- 📈 VOS3000 Gateway Analysis
- 📡 VOS3000 Real-Time Gateway ASR
- 🔧 VOS3000 System Log Audit
- ⚙️ VOS3000 Parameter Description
- 📞 VOS3000 Softswitch VoIP
📞 Still have questions about VOS3000 historical performance analysis? Reach out on WhatsApp at +8801911119966 — we provide professional VOS3000 installation, configuration, and quality analytics services worldwide. 🌐
📞 Need Professional VOS3000 Setup Support?
For professional VOS3000 installations and deployment, VOS3000 Server Rental Solution:
📱 WhatsApp: +8801911119966
🌐 Website: www.vos3000.com
🌐 Blog: multahost.com/blog
📥 Downloads: VOS3000 Downloads
 | | |